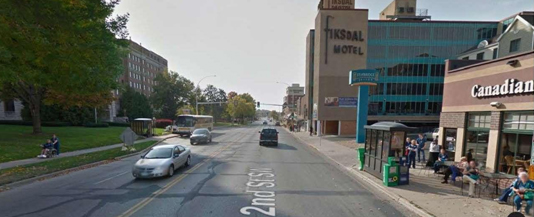
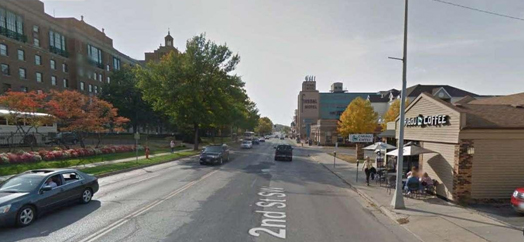
Planning is underway for Phase 4 of the 2nd Street SW reconstruction. Pending anticipated funding, this phase will include reconstruction of 2nd Street SW from Highway 52 to 11th Ave SW (near Virgil’s Auto). This segment is sure to be one of the most complex phases given the limited right-of-way available, with local businesses along the north side, and the Mayo Clinic Hospital - St. Marys campus on the south side.
The primary objective of the project is similar to that of previous phases, which is to replace deteriorated pavement, concrete sidewalks, curb, and gutter, and potentially address any known deficiencies with underground piping infrastructure.
Secondary objectives may include improving safety and efficiency for the diverse modes of transportation present through this segment, including pedestrians, automobiles, bicyclists, city transit, and private shuttles, buses, and taxis.
A key observation through this segment of 2nd Street SW is the level of pedestrian activity. It is not uncommon to observe pedestrians crossing the street from the hospital over to one of the many local business across the street. Among numerous other active commercial uses, the flower shop, restaurants, hotels, and coffee shops all rely a great deal on foot traffic from patients, staff, and guests of the hospital. Pedestrian crossings are both structured and unstructured - marked and unmarked. Exiting directly north out of the main hospital entrance leads one to a safe and convenient signalized pedestrian crosswalk leading directly across the street to the destination shops.
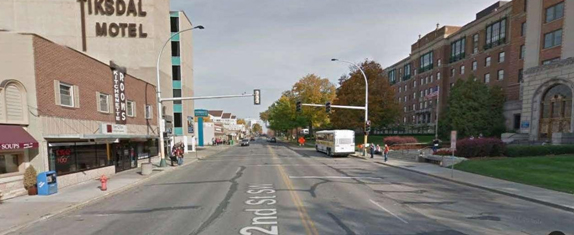
A less structured crossing example would be the frequently observed staff or visitor exiting the east hospital doors and walking mid-block straight across to the Caribou Coffee.
In the wintertime cold, the most common way of doing this is FAST! Pedestrians will always choose the most direct route, especially during cold winter months.
Due to the frequency and volume of pedestrian traffic crossing 2nd Street SW throughout all hours of the day, a perception exists that this roadway is very unsafe for pedestrians. Drivers clutch their steering wheels even tighter and slow down as they navigate this segment, expecting that at any moment a pedestrian will dart out in front of them. Given this frequency of “jaywalking,” certainly there must be accidents all the time.
The data tell another story.
From the MnDOT Office of Traffic, Safety, and Technology
Pedestrian-Vehicle crash data from for 2004-2013 by type:
11 crashes
0 - “K” Fatal
0 - “A” injury crashes
9 - “B” injury crashes
2 - “C” injury crashes
0 - PDO injury crashes
MnDOT provides the following infographic to explain the types of injury crashes:
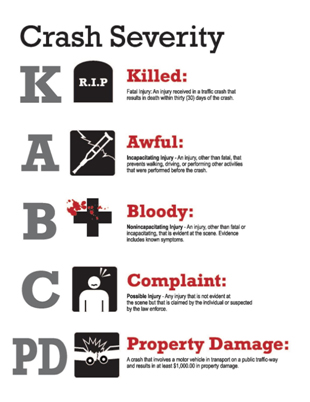
It’s not uncommon for perception to not align with reality; after all, perception is reality. However, the actual reality based on data is that this segment is relatively safe for pedestrians (an average of basically 1 injury per year). In fact, counter-intuitive as it may seem, the very presence of pedestrians, and the perceived risk on behalf of drivers, encourages drivers to slow down (thus improving safety). Most who are familiar with this street segment would likely claim to observe relatively moderate speeds through this segment - 30 mph or less. At the same time, most users would also claim that this segment operates with a high level of congestion. Furthermore, pedestrians tend to pay more attention when “jaywalking” or crossing at an unmarked crosswalk than when crossing at marked locations.
When re-designing a street, traffic engineers are tasked with prioritizing competing objectives.
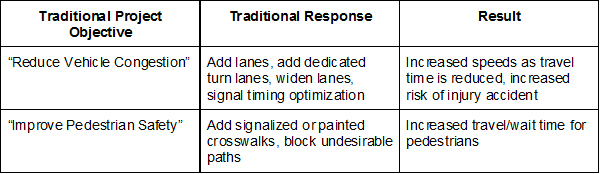
How does an engineer design a roadway that both improves pedestrian safety but also reduces congestion? Traffic engineers have worked for decades to find a solution, but perhaps a solution just doesn’t exist. It seems that after thousands of projects just like this one, only one of two competing objectives may be achieved, almost always at the expense of the other. For all local street projects, the most vulnerable user should take precedence in design. A thousand fender-benders are far more acceptable than just one pedestrian fatality.
Traditional project objectives such as the two listed in the above table tend to be subjective. It is impossible for a design engineer to objectively measure the success or failure of “reducing vehicle congestion” without a benchmark of current-state data. Engineers tend to be quick to jump to “solutions” based on hunches and previous experiences prior to thinking critically about what, if any, problem exists and identifying appropriate objectives based on real data analysis (a.k.a. design-thinking). Data is messy and takes time and effort to gather and evaluate.
Before even starting the re-design of 2nd Street Phase 4, the following data should be gathered and evaluated to use as a baseline for measuring improved performance:
- Single-occupancy vehicle counts
- Public/private transit bus/shuttle counts
- Pedestrian counts
- Bicycle counts
- Average vehicle speed across entire segment and sub-segments
- Average vehicle Level-of-Service (LOS) at key intersections
- Average pedestrian Level-of-Service (LOS) at key intersections
- Average/Peak-Hour vehicle travel times
Once the appropriate current-state data is collected, measurable performance goals can then be set based on the above metrics.
Statistics show that the risk of pedestrian death increases exponentially with speed:
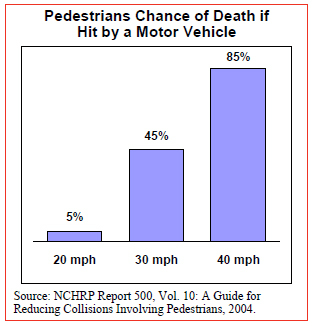
Based on the above graphic and the desirable pedestrian use of this segment, Design Rochester proposes the following measurable project performance objective that should guide all design decisions:
20 mph Design Goal Speed
During the design process, numerous decisions will need to be made including:
- How many vehicle lanes are appropriate?
- Are dedicated turn lanes are appropriate and where?
- What is the appropriate vehicle lane width?
- Will on-street parking be maintained?
- Will curb bump-outs be installed?
- Will street trees or other buffer zone infrastructure be included?
When uncertainty exists in answering any of the above questions first ask the question, “does this design element help achieve a 20mph design speed?” A “yes” answer will assure both the design engineer and the public of an intentional positive, reliable outcome.
For the 0.4 mile segment between Highway 52 and 11th Avenue, the time delay difference between an average speed of 20 mph and 30 mph is just 24 seconds. Is 24 seconds of anyone’s life worth more than the 40% increase in risk of death?
A design speed performance goal is both measurable and achievable through proven and effective implementation strategies. Any design decision which does not or cannot support the 20mph average goal speed through the segment must be considered dangerous and should not be considered for implementation.